
At the height of the 2008 recession, about one million individuals in Canada were receiving Employment Insurance (EI) regular benefits, designed to support those who lose their jobs through no fault of their own and are available for and able to work but cannot find employment. That number almost doubled during the COVID-19 pandemic. Even in stable times, nearly half a million individuals receive monthly support through EI regular benefits.
But how is such an important program funded?
The EI program is funded through premiums paid by employees and employers. Each year, in accordance with the Employment Insurance Act (EI Act), the premium rate-setting process starts with a calculation of the expected cost of the program over the next seven years. The 7-year forecast break-even rate is set so that EI premiums, based on that rate, will cover projected expenses for the next seven years, as well as any expected outstanding surplus or deficit that has cumulated between 2009 and the end of the current calendar year in the EI Operating Account.[1] While the Office of the Chief Actuary (OCA) calculates the 7-year forecast break-even rate, the Canadian Employment Insurance Commission is responsible for setting the premium rate, which can differ from the 7-year forecast break-even rate.[2]
The purpose of this paper is to provide information on the methodology used by the OCA to estimate the cost of future EI regular benefits in the context of the 7-year forecast break-even rate. While the EI program includes many types of benefits, such as sickness and parental benefits, the focus here is EI regular benefits since they represent more than 50% of total EI benefits paid. In addition, this paper highlights the uncertainty inherent in the underlying assumptions and their potential impact on the EI program.
| THE OFFICE OF THE CHIEF ACTUARY The OCA, as an independent unit within the Office of the Superintendent of Financial Institutions, provides actuarial advisory services to the Government of Canada. As part of its mandate, the OCA conducts statutory actuarial valuations for federal public-sector employee pension and insurance plans, and a range of Canadian social security programs, including EI. |
Projecting EI regular benefits
The total amount of regular EI benefits paid in a given year can be determined with the following formula:
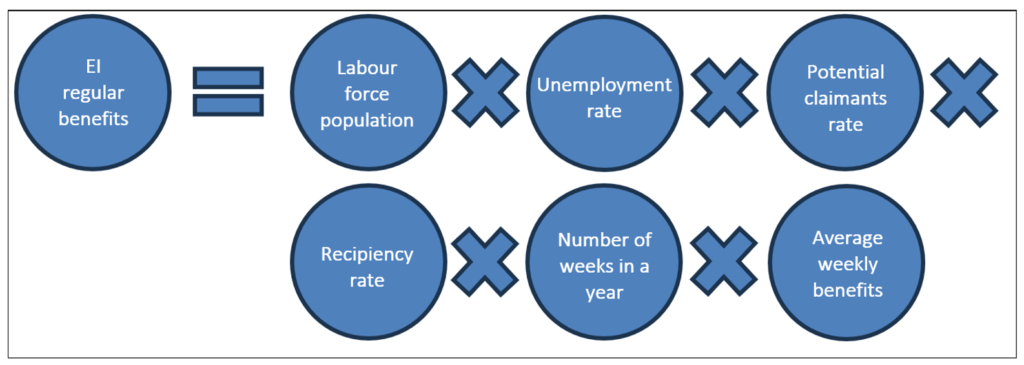
To determine the 7-year forecast break-even rate, each of the components of the formula is projected over a seven-year horizon, as described below. Some of the assumptions used in the projections are determined by the OCA, while others are prescribed by the EI Act and provided by the Government of Canada.
Labour force population
The size of the labour force – defined as individuals aged 15 and over who are either employed or actively seeking employment – is determined based on demographic projections produced by Statistics Canada and projections of the labour force participation rate developed by the Department of Finance.
This assumption is provided to the OCA by the Department of Finance.
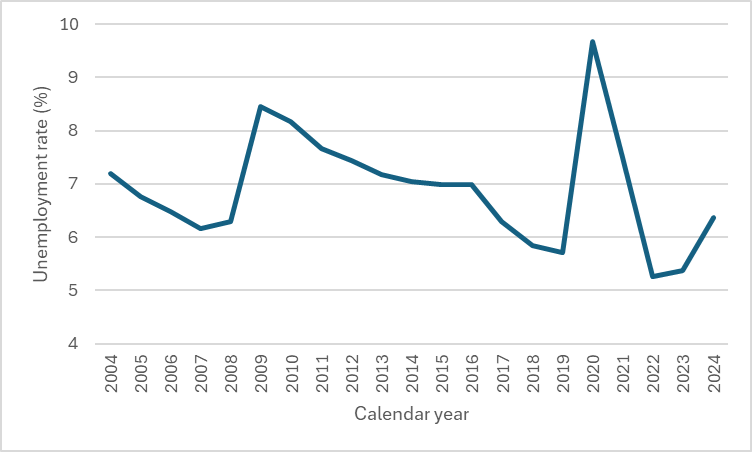
Unemployment rate
This assumption represents one of the most influential inputs in the actuarial projection model and is derived from the Department of Finance’s private sector survey. Specifically, it reflects the average unemployment rate forecast compiled from a range of private-sector forecasters, including major financial institutions, academic bodies and research organizations.
This assumption is provided to the OCA by the Department of Finance.
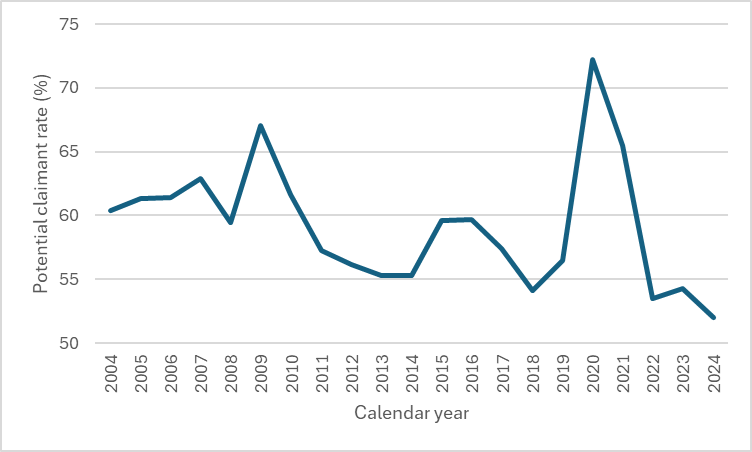
Potential claimants rate
This assumption reflects the proportion of the unemployed population that potentially meet criteria to receive EI benefits. It excludes:
- individuals who have never been employed (e.g., those seeking their first job),
- individuals who have been unemployed for more than one year,
- individuals who voluntarily left their employment,
- individuals who have not accumulated the minimum number of insurable hours,[3] and
- individuals who have exhausted their maximum allowable EI benefits.3
Individuals who are employed while receiving EI benefits are included in this assumption; while recipients may engage in paid work while receiving EI benefits, their benefit amounts are reduced.
This assumption is determined by the OCA. It is based on historical experience and actuarial judgment (e.g., anticipated changes in future experience).
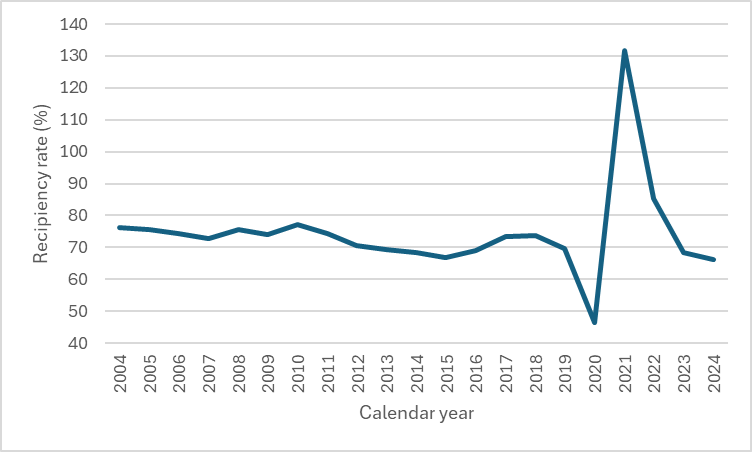
Recipiency rate
This assumption captures the proportion of potential claimants who receive EI benefits. The recipiency rate usually falls below 100% due to two main factors:
- a subset of eligible individuals chooses not to submit an EI claim, and
- all claimants are subject to a mandatory one-week waiting period, during which they are defined as unemployed but do not receive benefits.
This assumption is determined by the OCA. It is based on historical experience and actuarial judgment.
Number of weeks in a year
The number of weeks per year during which beneficiaries can receive EI regular benefits varies between 52.0 and 52.4, depending on the year.
Average weekly EI benefits
The average weekly EI benefits (AWB) are projected as follows:
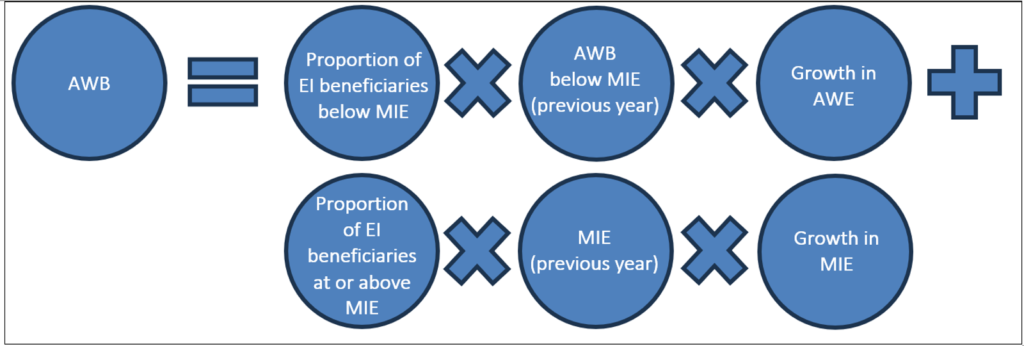
The AWB amount for claimants with insurable earnings below the maximum insurable earnings (MIE)[4] is projected to increase in line with the expected growth in average weekly earnings (AWE) on a calendar-year basis. In contrast, the MIE is indexed annually based on the year-over-year growth in AWE from April to May, as published by Statistics Canada. This indexing approach is prescribed under the EI Act and reflects a lagged response to wage growth.
An additional assumption is made regarding the distribution of EI beneficiaries relative to the MIE threshold – specifically, the proportion of claimants earning below versus at or above the MIE limit.
The latter is developed by the OCA based on historical experience and actuarial judgment, while the projected growth in AWE (and indirectly the growth in MIE) is provided by the Department of Finance.
Uncertainty
Although the OCA model estimating regular EI benefits is straightforward in structure, it is important to recognize the inherent uncertainty, as well as the impact on the EI program’s cost, associated with each variable. The sensitivity and potential variability of these assumptions are summarized in Table 1.
Table 1. Uncertainty of EI assumptions used in the calculation of EI regular benefits.
|
Impact on the EI program |
Assumption |
Description |
|
Low |
Labour force population |
An increase in the labour force population contributes to higher expected EI benefits due to potentially more claimants. However, the impact on the EI program remains low due to an offsetting rise in the number of individuals employed and contributing EI premiums. |
|
Number of weeks |
There is no associated uncertainty, as the value is determined. |
|
|
Average weekly benefits |
An increase in average earnings leads to higher expected EI benefits due to increased entitlements. However, the impact on the EI program remains low due to higher expected EI premium contributions from the workforce. |
|
|
High |
Unemployment rate |
|
|
Potential claimants rate |
|
|
|
Recipiency rate |
These variations introduce additional uncertainty into recipiency rate estimates.
|
Given the potential influence of key assumptions and variables on the EI program’s projections, the OCA includes in its report the expected impacts of hypothetical economic shock scenarios. These scenarios are designed to illustrate the sensitivity of the EI program to adverse conditions and to provide insight into the robustness of the actuarial projections under varying economic environments.
Conclusion
While this paper focuses on the methodology used by the OCA to estimate regular EI benefits, OCA’s 2026 EI actuarial report provides a more extensive analysis, including detailed methodologies and assumptions pertaining to other EI benefits and earnings-related parameters.
Appendix
The views expressed in this paper are those of the authors and not an official position or opinion of the Canadian Institute of Actuaries.
[1] The EI program’s financial transactions are reported through the EI Operating Account, which is established in the Public Accounts of Canada, the federal government’s financial statements.
[2] In special circumstances, and as stated in the EI Act, the Government of Canada has the authority to set the EI premium rate. For example, this occurred during the COVID-19 pandemic, when the EI premium rate was frozen to provide financial relief for workers and employers.
[3] Due to data limitations, these individuals noted in the last two bullet points are treated as reducing the recipiency rate rather than the potential claimants rate.
[4] The MIE represents the income level up to which EI premiums are paid and EI benefits calculated.